User Guide
1 Quick Start
# 1. Clone the repository
git clone https://github.com/boehlernick/IMPACT-VIS.git
cd IMPACT-VIS

# 2. Install system prerequisites (Debian/Ubuntu/WSL)
sudo apt update
sudo apt install -y build-essential pkg-config cmake libnlopt-dev libuv1-dev libcurl4-openssl-dev libssl-dev libxml2-dev zlib1g-dev

# 3. Install R dependencies
R -e "install.packages('renv'); renv::restore(prompt = FALSE)"

# 4. Launch the app
R -e "shiny::runApp()"

# 5. Open the URL printed in the console (e.g., http://127.0.0.1:xxxx)
Done! You should see the IMPACT-VIS interface with demo sample data already loaded.
2 System Overview
IMPACT-VIS is the visualization and curation layer of the broader IMPACT genomic interpretation pipeline.
Upstream Modules (Preprocessing):
IMPACT-SNV: Converts raw SNV VCF → annotated GDS files with IMPACT scoring
IMPACT-SV: Converts raw SV VCF → AnnotSV-annotated TSV files with phenotype filtering
IMPACT-CNV: Converts raw CNV VCF → SCIP-annotated TXT files with read-depth validation
This Guide: Setting up IMPACT-VIS to visualize outputs from upstream modules.
This quick-start uses demo data that has already been preprocessed by IMPACT modules.
3 Prerequisites
- R ≥ 4.0 (download from https://www.r-project.org/)
- Git (for cloning the repository)
- System libraries (Debian/Ubuntu/WSL): build-essential, pkg-config, cmake, libnlopt-dev, libcurl4-openssl-dev, libssl-dev
- 4 GB RAM minimum
- Modern web browser (Chrome, Firefox, Safari, Edge)
Optional: Docker (for containerized deployment)
4 Installation Methods
4.1 Method 1: Local Development (Recommended for First-Time Users)
This is the simplest method for getting IMPACT-VIS up-and-running.
Step 1: Clone Repository
git clone https://github.com/boehlernick/IMPACT-VIS.git
cd IMPACT-VIS
Step 2: Install system prerequisites (Debian/Ubuntu/WSL)
sudo apt update
sudo apt install -y build-essential pkg-config cmake libnlopt-dev libuv1-dev libcurl4-openssl-dev libssl-dev libxml2-dev zlib1g-dev
Step 3: Restore R Environment
R -e "install.packages('renv'); renv::restore(prompt = FALSE)"This installs all packages with exact versions specified in renv.lock. May take >10 minutes for initial install depending on internet speed.
Step 4: Launch Application
R -e "shiny::runApp()"You should see output similar to:
Listening on http://127.0.0.1:xxxxStep 5: Open in Browser
Click the link printed in the console (e.g., http://127.0.0.1:xxxx) in your web browser.
4.2 Method 2: Docker
Encapsulates all dependencies; consistent across all systems.
Step 1: Build Image
git clone https://github.com/boehlernick/IMPACT-VIS.git
cd IMPACT-VIS
docker build -t impact-vis:latest .
Takes ~3-5 minutes first time (layer caching speeds up subsequent builds).
Step 2: Run Container
docker run -p 3838:3838 impact-vis:latestStep 3: Open in Browser
http://localhost:3838
To use your own data:
docker run -p 3838:3838 \
  -v /path/to/your/data:/app/app/data:ro \
  impact-vis:latest
4.3 Method 3: RStudio
If you prefer RStudio, you can launch from the IDE:
- Clone & open:
File -> Open Project...and select theIMPACT-VISfolder (orFile -> New Project -> Existing Directory). - Install system prerequisites (Debian/Ubuntu/WSL terminal):
sudo apt update
sudo apt install -y build-essential pkg-config cmake libnlopt-dev libuv1-dev libcurl4-openssl-dev libssl-dev libxml2-dev zlib1g-dev- Restore R packages (one-time): In the RStudio Console, run:
install.packages("renv")
renv::restore(prompt = FALSE)- Run the app: Click the Run App button in the RStudio toolbar, or run in the Console:
shiny::runApp()- Open the app: Use the URL printed in the RStudio Console (e.g.,
http://127.0.0.1:xxxx).
On Windows without WSL, install Rtools and the libcurl/openssl build deps, or use the Docker method if native system libraries are unavailable.
5 First Analysis
5.1 Step 1: Initiate the app and select a sample
When IMPACT-VIS loads, you’ll see:
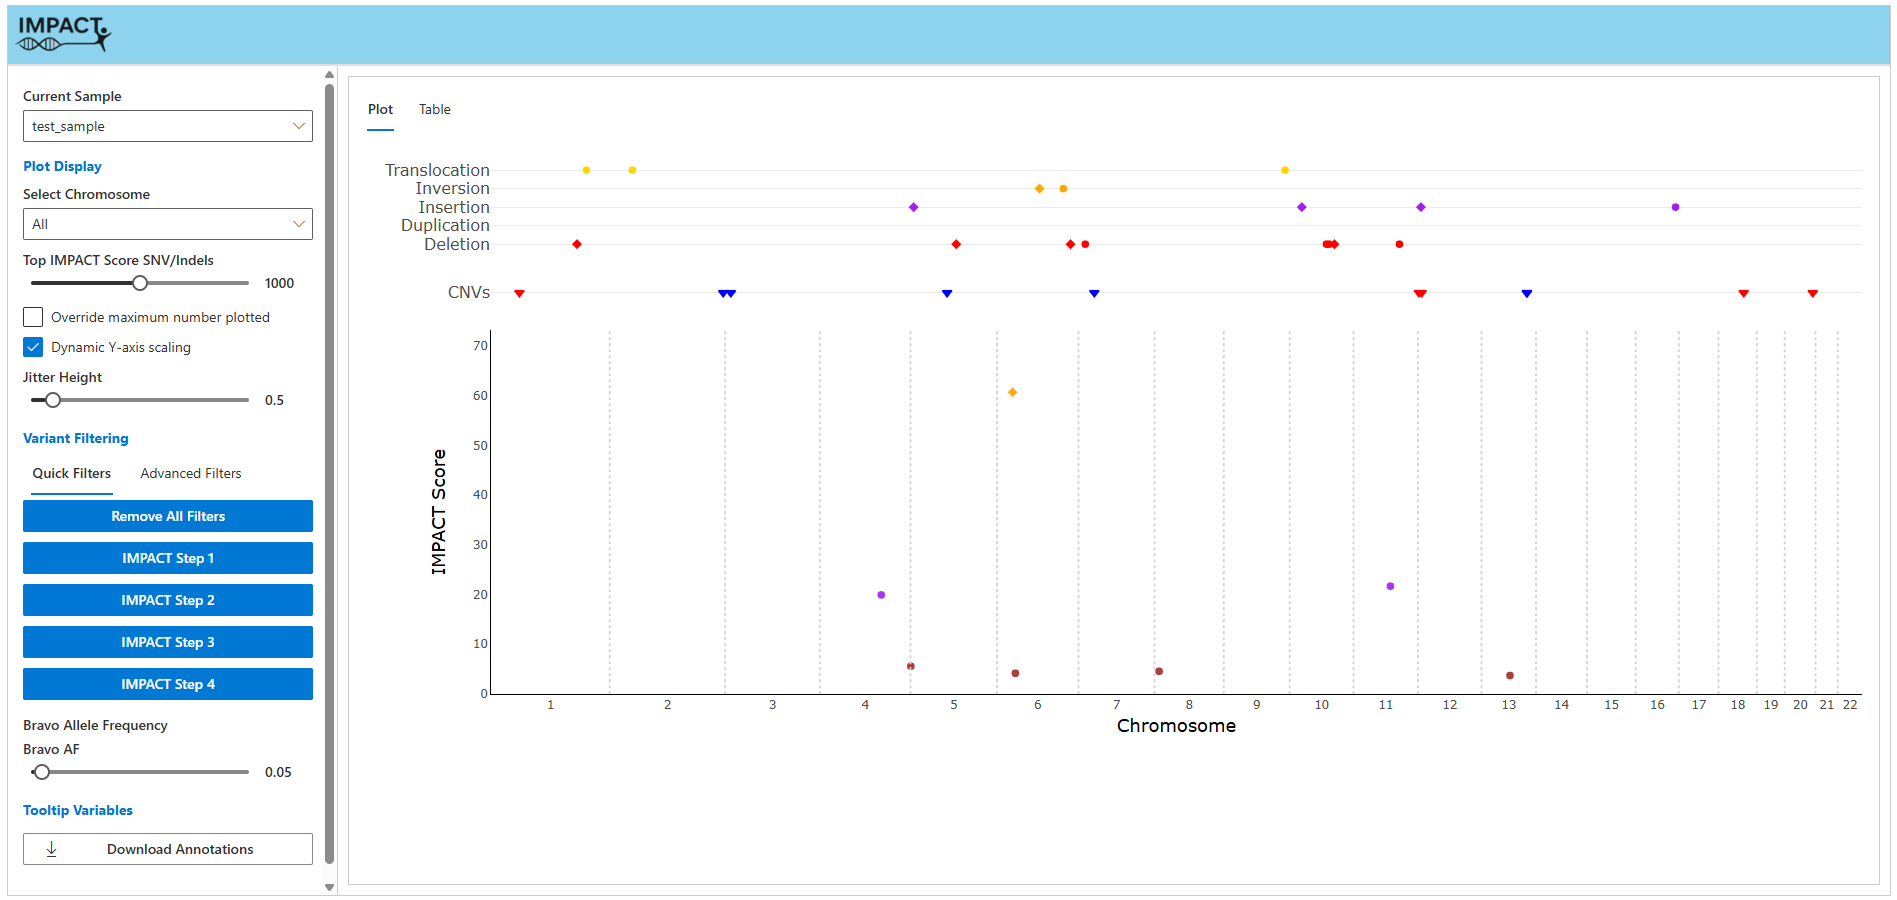
The app comes with a test_sample bundle pre-loaded. You can also add your own input files to app/data/ and select any valid sample from the dropdown.
5.2 Step 2: Plot Display Settings
In the Plot Settings panel (left sidebar), choose:
- Chromosome to display
- Maximum number of variants to be plotted on the GDS subplot
- Override settings for maximum variants (caution: memory intensive)
- Dynamic Y-axis scaling setting will automatically configure the GDS subplot Y-axis in accordance with IMPACT score values of variants currently displayed. Turning this setting off will restrict axis to 0-100.
5.3 Step 3: Adjust Filters
Adjust filters to focus on variants of interest:
- ClinVar Status: Pathogenic, VUS, Benign
- Allele Frequency: Set threshold (default 1%)
- Genotype: Heterozygous, Homozygous, Both
The plot updates automatically as you change these controls.
Start with default IMPACT quick filters, then progressively add custom filters as needed.
5.4 Step 4: Explore the Plot
Interact with the visualization:
- Hover: See variant details (name, position, annotations)
- Click: Open detailed variant modal with additional information
- Zoom: Click + drag to zoom into region
- Pan: Hold shift + drag to move around
- Reset: Double-click to zoom out
5.5 Step 5: Export Results
In the Export panel:
- Download Annotations: Downloads a ZIP archive containing curated SNV/Indel, SV, and CNV CSV files for the current sample
- Plot Image: Use the Plotly toolbar camera button above the combined plot to export the current view as a PNG
6 Sample Data
The repository includes a demonstration sample in app/data/:
app/data/
├── test_sample_SNV_IMPACT.gds
├── test_sample_SV_IMPACT.tsv
└── test_sample_CNV_IMPACT.txt
6.1 About Demo Data
- A small subset of randomly selected variants from UK Biobank whole-genome sequencing samples. All identifying features have been stripped from the variants and genotypes were programatically assigned. Therefore, while these variants have been identified in real samples, the configurations may not be real and should not be interpreted as such. The purpose of the test_sample is to allow users to quickly interact with IMPACT-VIS.
7 Using Your Own Data
This section assumes you have preprocessed variant files from the IMPACT pipeline modules. If you only have raw VCF files, you must first run IMPACT-SNV, IMPACT-SV, and/or IMPACT-CNV preprocessing.
7.1 Prerequisites
You must have completed upstream preprocessing to generate:
| Data Type | Expected File | Required? | Source |
|---|---|---|---|
| SNV/Indel | {sample}_SNV_IMPACT.gds |
Yes | IMPACT-SNV |
| Structural Variants | {sample}_SV_IMPACT.tsv |
No | IMPACT-SV |
| Copy Number Variants | {sample}_CNV_IMPACT.txt |
No | IMPACT-CNV |
If you only have raw VCF files, see IMPACT-SNV Documentation to preprocess them first.
7.2 Step 1: Organize Your Files
Place all sample files directly in app/data/:
cd /path/to/IMPACT-VIS

# Copy preprocessed files
cp /path/to/sample001_SNV_IMPACT.gds app/data/
cp /path/to/sample001_SV_IMPACT.tsv app/data/
cp /path/to/sample001_CNV_IMPACT.txt app/data/

# Repeat for additional samplesFiles must be in app/data/ root directory, NOT in subdirectories. IMPACT-VIS auto-discovers samples by scanning for *_SNV_IMPACT.gds files.
7.3 Step 2: Launch IMPACT-VIS
R -e "shiny::runApp()"Your samples will appear in the Sample Selector dropdown automatically.
7.4 Step 3: Verify Data Loaded
- Expand Sample Selector dropdown
- Check that your sample IDs appear
- If you added files after the app was already running, restart IMPACT-VIS so it rescans
app/data/ - Select a sample and verify plot loads
For detailed troubleshooting, see Data Preparation.
8 Next Steps
- New to R? See R Basics tutorial
- Need help loading your data? Follow Data Preparation
- Questions? Open GitHub Issue
9 Troubleshooting
9.1 “Error: GDS file not found”
Demo data not properly loaded.
Solution:
# Verify files exist
ls -la app/data/

# If missing, reinstall from GitHub
git clone https://github.com/boehlernick/IMPACT-VIS.git
cd IMPACT-VIS
9.2 “Slow performance / App hangs”
Too many variants to display.
Solution: Reduce the number of variants displayed using the “Top IMPACT Score SNV/Indels” slider in the Plot Settings panel.
9.3 Docker image won’t build
Dependency installation failed.
Solution:
# Rebuild without cache
docker build --no-cache -t impact-vis:latest .

# View full build log
docker build --progress=plain -t impact-vis:latest .
10 Support
- Documentation: https://boehlernick.github.io/IMPACT-VIS
- GitHub Issues: https://github.com/boehlernick/IMPACT-VIS/issues
- Email: nick.boehler@mail.utoronto.ca (contact maintainer)
Next: Ready to load your own data? → Data Preparation